Inaugural Feature / Investigations
The Gilded Mirage
Behind Hospitality’s High-RevPAR Facade
Strong room revenue is an incomplete account of American hospitality. Behind the gains sit maturing loans, contested working conditions, uneven technology benefits and systems whose resilience the industry cannot take for granted.
Inaugural edition · November 16, 2026. The available article includes reporting dated after November 16 and sources reviewed November 21, 2026.
View the original article PDF
The Gazette's inaugural feature examines the distance between a hotel's commercial performance and its capacity to endure. The evidence supports a recovery, but it also exposes the limits of measuring success at the reservation desk.
1. The paradox of peak performance
American hospitality knows how to present prosperity. The renovated lobby offers polished stone, flattering light and a promise that someone has anticipated every need. Strong room rates and confident corporate reporting supply the financial equivalent. A hotel can look successful from the street and from the first page of its performance report.
The difficulty begins further inside the business. A lender may be waiting for repayment. Employees may be questioning whether their compensation and schedules support a workable life. The next renovation may have no secure source of funding. The guests on whom the forecast depends may be reconsidering the journey, or unable to complete it.
How can an industry appear to be thriving while the businesses, workers and infrastructure supporting it face mounting pressure?
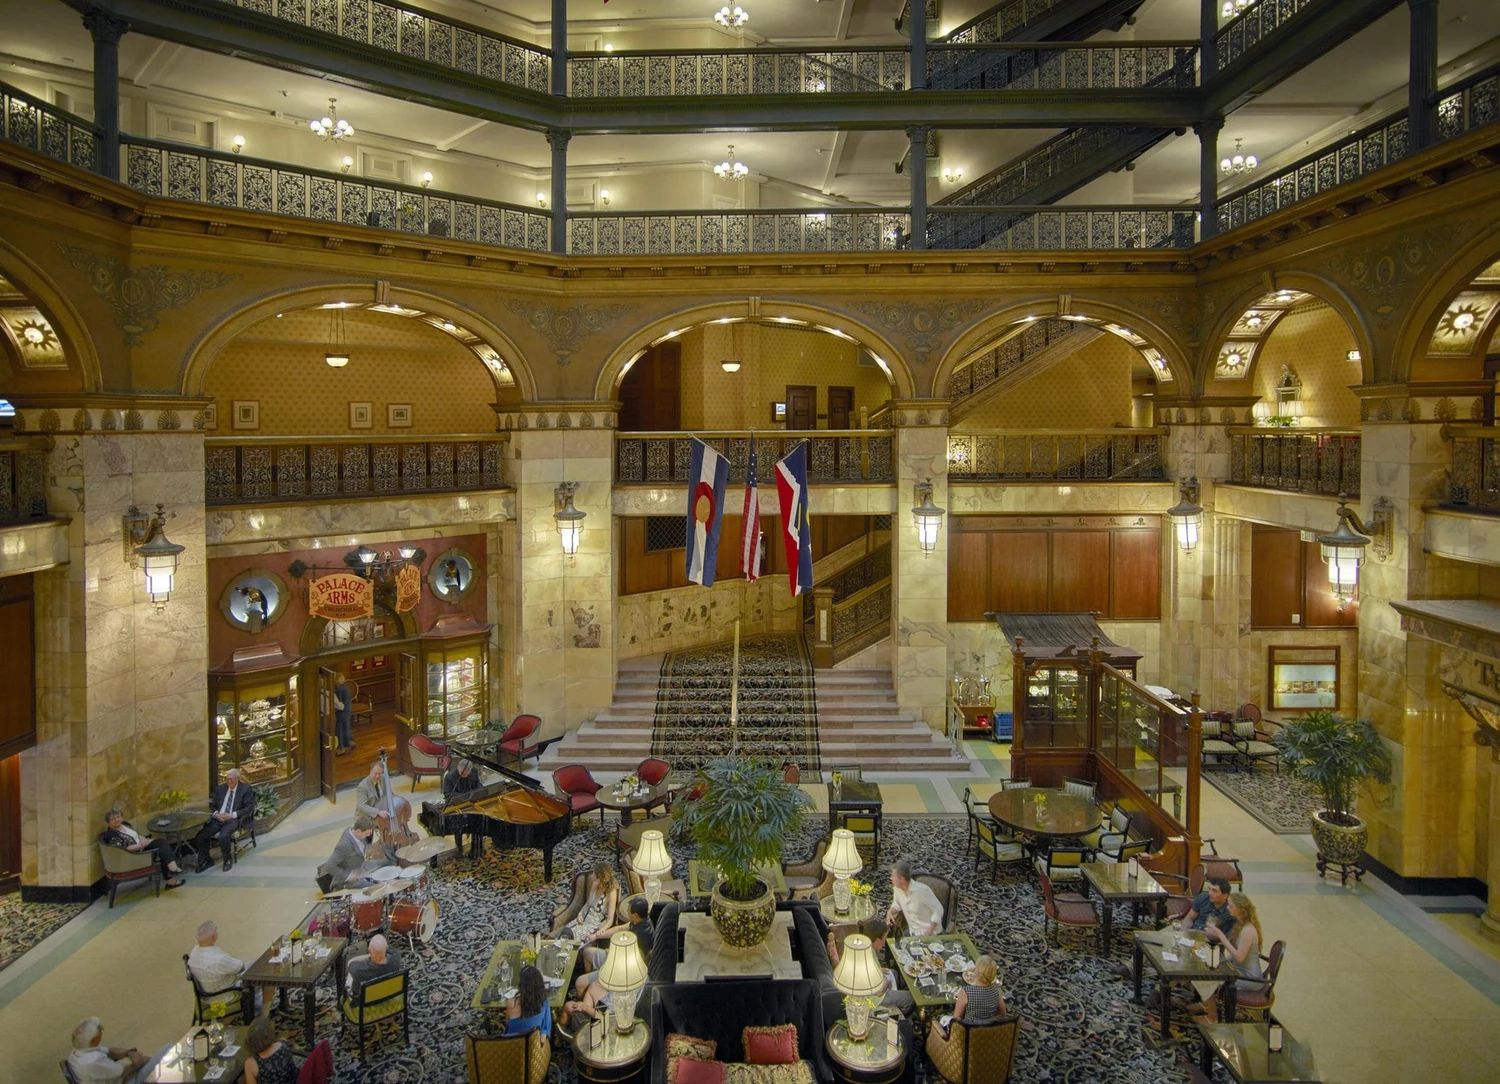
Guests in the atrium lobby of the Brown Palace Hotel, Denver, July 9, 2016. Photo 01 · Carol M. Highsmith / Library of Congress · Public domain · Full credit Source
The growth is real. CBRE reported that U.S. hotel revenue per available room rose 7.0% in the third quarter of 2026 from a year earlier. Average daily rate increased 4.3%, and occupancy reached 67.7%, a gain of 1.8 percentage points. Demand grew faster than supply.[1]
Average daily rate, or ADR, measures room revenue per room sold. RevPAR divides room revenue by all available rooms; equivalently, it multiplies ADR by occupancy expressed as a
decimal. It captures both price and the ability to fill inventory. It does not deduct payroll, insurance, distribution costs or interest. Nor does it report the condition of a boiler, the reliability of a reservation system or the experience of a room attendant finishing a shift.
Even the revenue story changes when the comparison changes. In its full report, CBRE put nominal third-quarter RevPAR 21% above the comparable 2019 level, while inflation- adjusted RevPAR remained 7.1% below it. The industry was taking in more dollars per available room without recovering the same purchasing power.[2]
Recent local results underline how unevenly success arrives. CoStar figures published by LODGING for the week ending November 7 showed national RevPAR up 4.7%, compared with 7.1% outside the largest 25 markets. St. Louis recorded an 18.6% RevPAR increase during a major church convention; Miami's ADR rose 11.6% to $245.59. Those local surges reveal the importance of events and destination demand beneath the national average.[3]
The danger lies in allowing a useful commercial measure to become a verdict on business health. Financial obligations, service delivery and the networks that bring travelers to a hotel operate on different clocks. A rising room rate can coexist with weakness in any of them. The investigation begins where the headline metric stops.
2. The maturity wall meets the balance sheet
A full hotel still has to answer its lender. Refinancing replaces an existing loan with new borrowing; recapitalization changes the combination of debt and equity supporting the investment. Either can preserve a viable property. Both can become difficult when the amount an owner needs exceeds what a new lender or investor will supply.
JLL's third-quarter investment figures, reported by Hotel Management, identify approximately $84 billion in hotel loans to known lenders scheduled to mature across 2026 and 2027: $33.7 billion and $50.1 billion, respectively. The schedule continues at $40.2 billion in 2028, $35.3 billion in 2029 and $31.7 billion in 2030.[4]
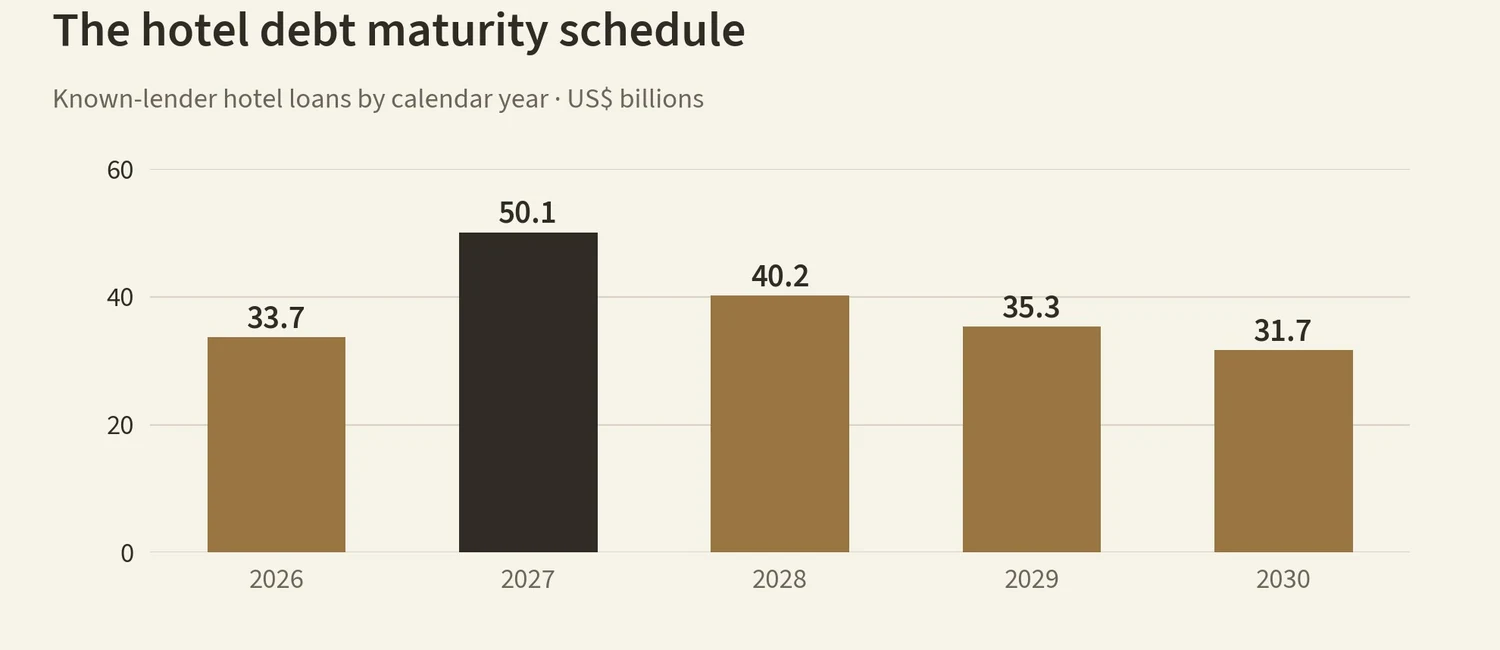
The schedule describes a substantial financing burden across two full calendar years. Some 2026 loans may already have been repaid, extended or refinanced. For owners still approaching maturity, the challenge is to secure replacement financing on terms the property can support.
The practical test is the cash available to support the replacement loan. Net operating income, or NOI, is property income after operating expenses and before debt service and certain other items. A debt-service coverage ratio, or DSCR, compares the income available under the lender's underwriting rules with required principal and interest payments.[5]
Consider a hypothetical hotel with $1.2 million in annual income available for debt service and $900,000 in annual loan payments. Its coverage is about 1.33 times. If replacement financing raises those payments to $1.1 million while income stays unchanged, coverage falls to about 1.09 times. The hotel has not lost a guest. Its financial cushion has nevertheless narrowed sharply.
Higher interest payments consume cash after debt service; rising operating expenses reduce NOI. An owner facing both pressures must solve both problems.
Brand obligations add another demand on capital. A property improvement plan, or PIP, specifies renovations or upgrades required by a brand. Replacing worn furnishings can protect guest value and future revenue, but an improvement requirement does not provide the money to pay for it. A hotel may need new equity to complete the work while also reducing its loan balance enough to qualify for refinancing.
Credit is still flowing. Hotel Management's account of JLL's research puts first-half 2026 hotel loan originations at $44.3 billion, versus $27.3 billion a year earlier, and describes financing conditions as stable. Banks and commercial mortgage-backed securities, or CMBS, remain important channels. CMBS pools commercial real estate loans into securities sold to investors.[4]
Access to that capital depends on an owner's balance sheet. Stronger sponsors can contribute equity, absorb a renovation and wait for operating gains. Owners with thinner reserves have fewer choices when a loan comes due, increasing the pressure to sell or bring in new investors.
A full hotel still has to answer its lender.
Hotel Dive reported JLL's tally of $22.2 billion in U.S. transactions through the third quarter, up 37%, with 928 transactions and $20.4 billion in single-asset sales. JLL executives described improving fundamentals and opportunities to refinance as well as sell. Private equity and wealthy private buyers together represented 42% of investment volume; twelve single-asset trades exceeded $1 million per room.[6]
The investment market remains active, with sales serving several purposes: realizing gains, closing out a fund, reshaping a portfolio or relieving financial pressure. The terms of each transaction reveal more about distress than the buyer's identity alone.
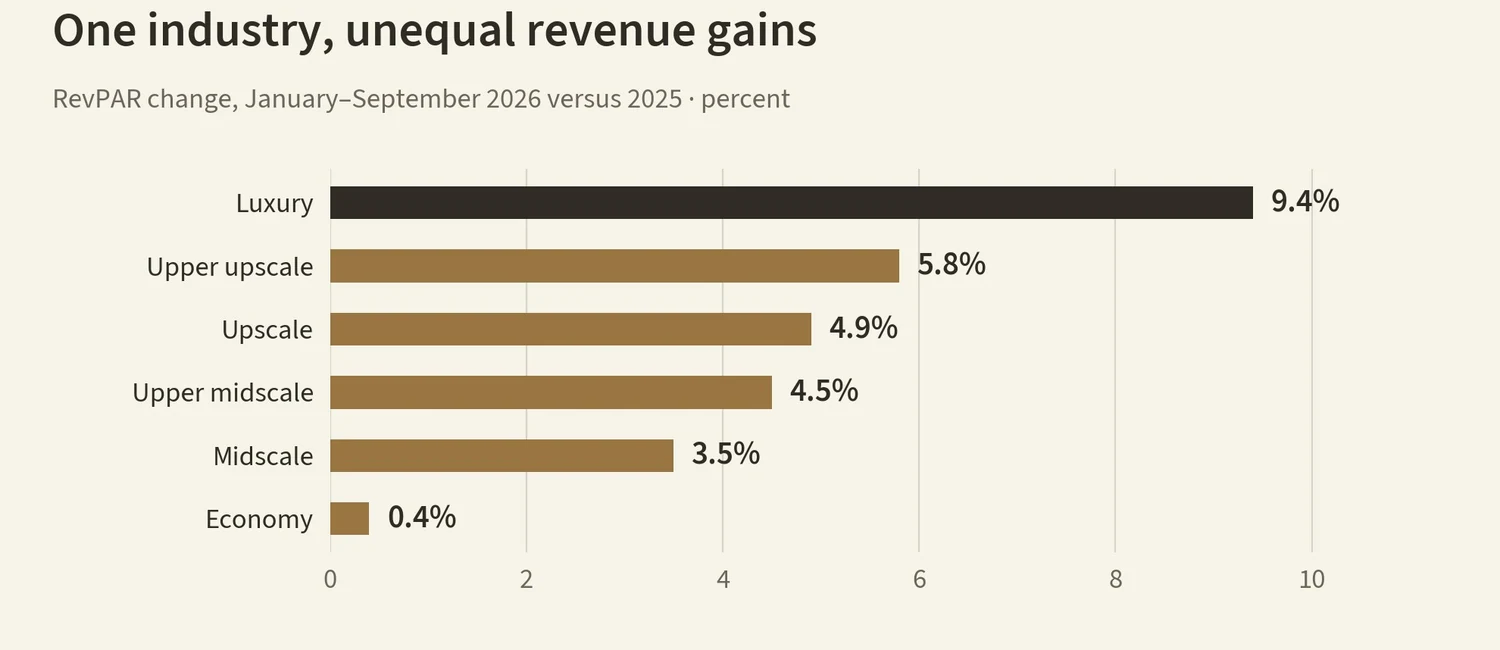
The chain-scale figures do reveal a widening commercial divide. Luxury RevPAR was 34.3% above its 2019 benchmark, compared with just 3.1% for economy hotels, in JLL's figures reported by Hotel Management.[4] A nominal gain is especially limited evidence of restored strength when it covers several years of rising costs.
Location also matters. JLL figures reported by Skift's Daily Lodging Report put year-to-date RevPAR growth through September at 19.4% in San Francisco, while New Orleans was down 6.4%.[7] That divergence shapes income prospects and the prices buyers are willing to pay.
A property's value also depends on its operating model, condition, facilities and capital needs. Full-service and select-service describe operating models; luxury and economy describe chain scales. Understanding the investment means examining how revenue, costs and financing fit together.
That question leads directly from the owner's balance sheet to the people whose work produces the revenue.
3. Picket lines behind the polished entrance
Payroll is an operating expense to the owner and a household income to the employee. Both descriptions are true. Conflict develops when a hotel's financial model depends on labor terms its workforce is no longer willing to accept.
At Encore Boston Harbor in Everett, Massachusetts, more than 1,300 workers represented by Teamsters Local 25 and UNITE HERE Local 26 struck beginning September 4. The Teamsters announced a five-and-a-half-year agreement in November, describing gains in pay, benefits and working conditions. Its bargaining contingent included 211 workers across departments such as valet, warehouse, cashier and guest experience.[8]
Workers ratified the agreement November 5 and returned November 6, according to WBUR, ending roughly nine weeks of disruption.[8, 9]
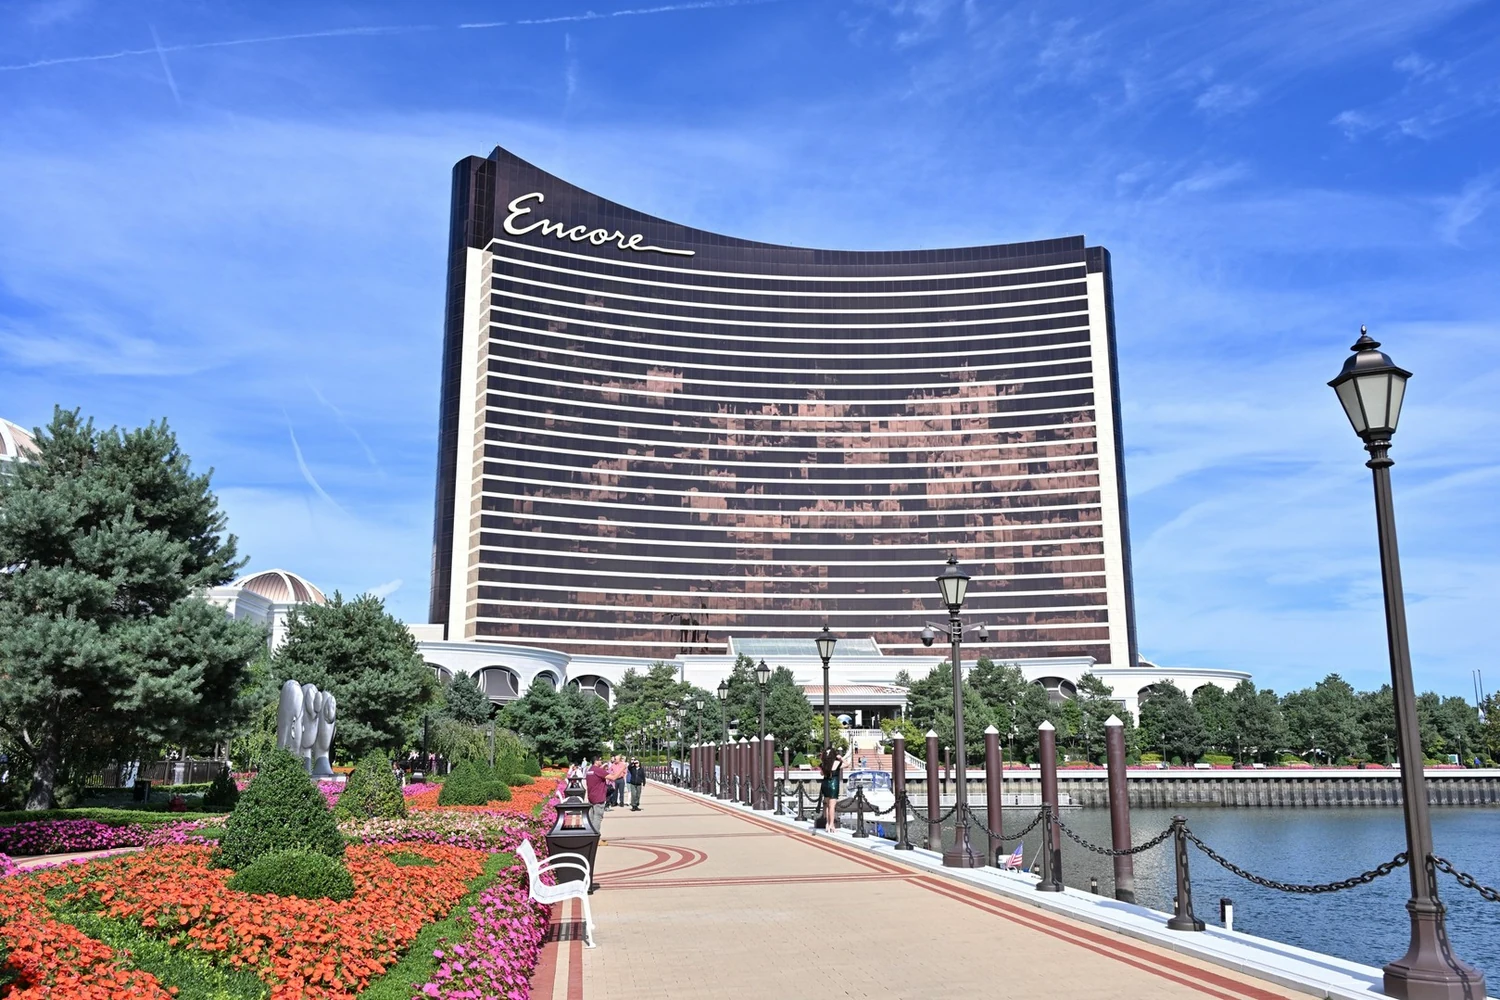
Encore Boston Harbor, viewed from the riverwalk, September 28, 2024. Photo 02 · 4300streetcar / Wikimedia Commons · CC BY 4.0 · Full credit Source
WBUR, citing Massachusetts Gaming Commission data, reported September gross gaming revenue of approximately $46.1 million, down about 22.1% from $59.1 million a year earlier. Those figures track casino revenue during the strike; they do not isolate the strike's cost. Wynn told WBUR the agreement supported employees and the property's long-term future.[9]
The lesson is larger than the size of the decline. A luxury product depends on an operating relationship with its employees. A brand promise cannot clean a room or staff a banquet
when that relationship breaks down. The resulting risk belongs in an owner's assessment of the business before negotiations become a crisis.
Chicago's dispute shows how that exposure can extend across a market. UNITE HERE said negotiations covered more than 7,000 workers at 46 hotels. The first six hotel walkouts began October 9 ahead of the Chicago Marathon.[10]
By November 16, Hotel Dive reported walkouts at eleven properties, following the Royal Sonesta, Marriott Marquis and The Wade Hotel joining on November 14. The earlier group included the Sheraton Grand, Waldorf Astoria, Palmer House, two Westins, Millennium Knickerbocker, Hilton Chicago and Hyatt Regency Chicago. The union sought higher wages, healthcare and pension improvements, civil-rights protections and safer workloads. Marriott told the outlet it had operating contingency plans and remained available to negotiate.[11]
CBRE reported hotel wage growth of 4.7% year over year in the third quarter, exceeding its reported 3.5% inflation rate.[2] That improvement matters. So do the hours behind the hourly rate and the local costs a paycheck must cover.
For a general manager, an hourly rate and a payroll percentage answer different questions. A higher hourly wage can coexist with an unstable weekly paycheck if hours fluctuate. A tightly controlled payroll can coexist with costly vacancies, repeated training and service failures. Assessing labor economics requires following those consequences beyond the wage line.
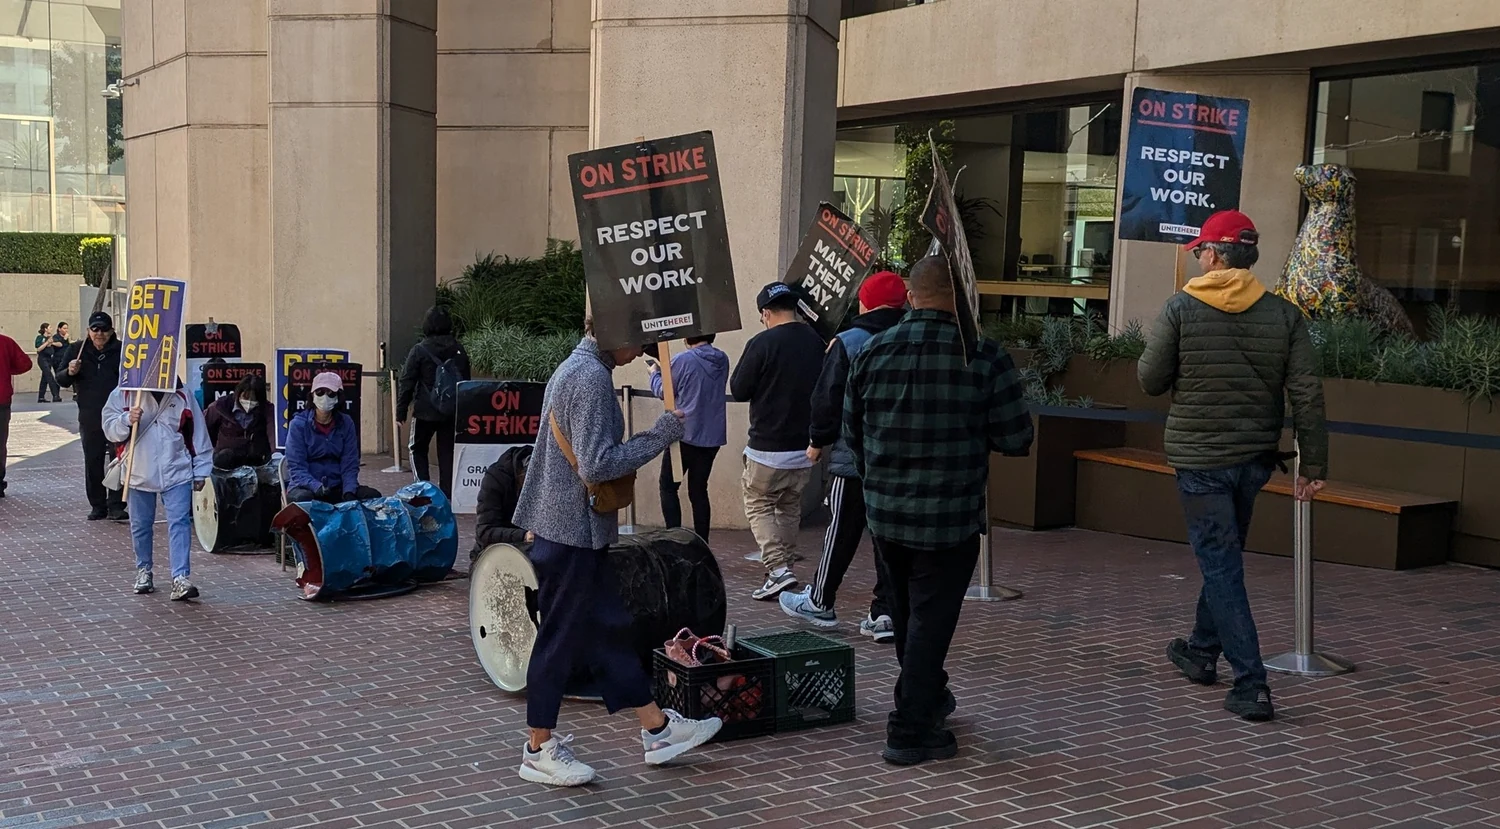
UNITE HERE Local 2 demonstrators outside the Grand Hyatt San Francisco, November 8, 2024. Photo 03 · Mx. Granger / Wikimedia Commons · CC0 1.0 · Full credit Source
Labor agreements and workload conditions are operating fundamentals. They belong alongside financing assumptions in any serious account of hotel resilience.
4. Who receives the AI dividend
Technology promises a way through the tension: less administrative work, better forecasts and more productive hours. There is a credible use for those tools. The unresolved question is who receives the time they save.
AHLA's November report with software provider Actabl exposes a sharp divide in how hotel company leaders perceive AI's benefits: 84% said it improved their own work, while just 15% said it improved frontline work—a 69-percentage-point gap.[12]
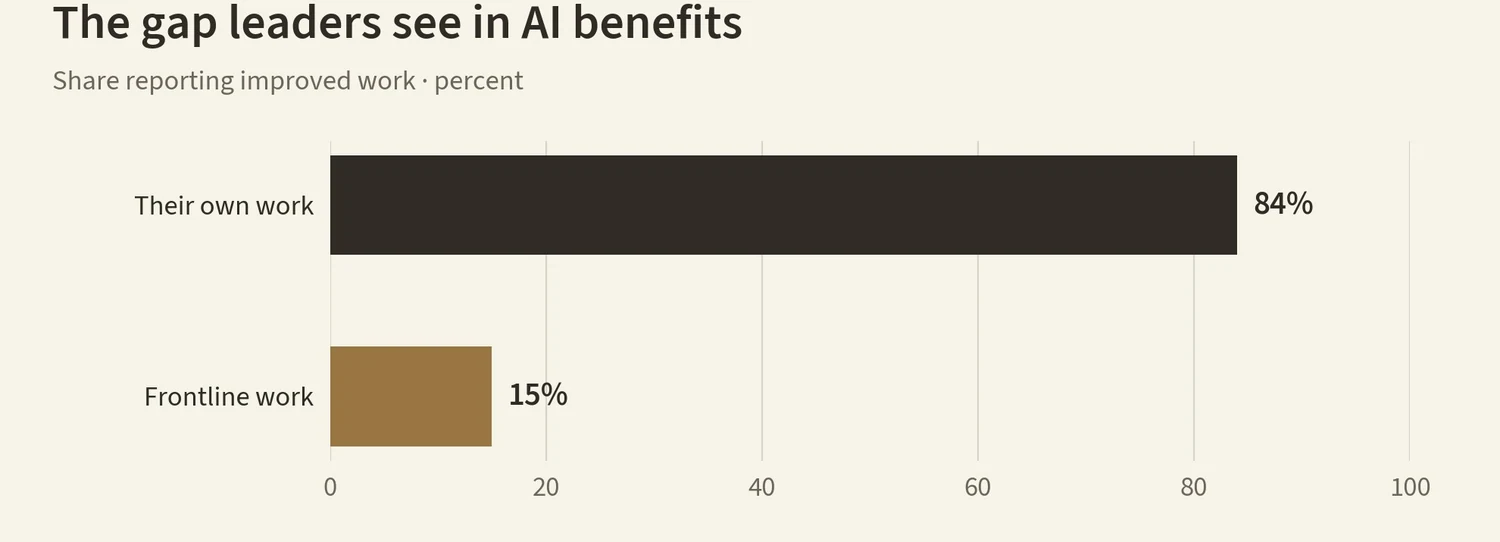
The underlying State of Hotel AI study surveyed 107 hotel company leaders online in August and September 2026. Its percentages reflect those who answered each question.[12, 13]
That gap puts the burden on management to follow the benefits beyond the office. Does a room attendant finish a shift with less strain? Does a desk agent receive better support? Does a maintenance technician gain time for preventive work? Those are the outcomes that would give frontline productivity a practical meaning.


A service robot at YOTEL in downtown Miami, December 6, 2022. Photo 05 · Phillip Pessar / Flickr via Wikimedia Commons · CC BY 2.0 · Full credit Source
A housekeeper cleans a hotel window in Istanbul’s Taksim district, May 26, 2012. Photo 04 · l0da_ralta / Flickr via Wikimedia Commons · CC BY 2.0 · Full credit Source
Nor do labor-efficiency measures answer those questions automatically. AHLA reports that hours per occupied room, or HPOR, fell 3.1% at full-service hotels and 3.5% at select-service hotels using Actabl's Hotel Effectiveness platform in the first half of 2026, even as occupancy rose.[12] HPOR divides labor hours by occupied rooms. It measures labor input per unit of room demand, not service quality or workload fairness.
Better scheduling and higher occupancy can both lower HPOR. Service levels, outsourcing and departmental coverage also affect the ratio. The Actabl figures describe results among its software users; they do not isolate AI's contribution.
For the operator, the useful test is what happens after the ratio improves. If an hour saved from preparing reports becomes an hour of coaching or inspection, the benefit can reach the guest and employee. If fewer paid hours leave necessary work unfinished, the apparent efficiency may be borrowing against future service quality.
At Cote Hospitality, the report describes AI supporting mentorship and service-training programs called G.U.I.D.E. and G.R.A.C.E.[14] That company account points toward a broader ambition for the technology: helping employees develop and deliver better service.
Retention has improved in the Actabl-based data. AHLA's report gives average monthly turnover rates of 5.73% in 2024, 5.32% in 2025 and 5.15% in the first half of 2026; its June observations fall from 6.07% in 2024 to 5.35% in 2026.[14] Even with that improvement, hotels face a recurring burden of hiring and training.
At a hypothetical 5% monthly turnover rate, a hotel maintaining 100 positions would record roughly 60 separations over a year, including any repeat turnover among replacements. That is a substantial recruitment load for a business whose service depends on experience and continuity.
The broader benchmark study reports that only 24% of respondents said AI had paid for itself overall, while 28% considered it too early to tell.[13] Personal productivity, financial
return and improved frontline conditions are separate outcomes. The industry needs to measure all three before declaring that technology has resolved its workforce economics.
Personal productivity, financial return and improved frontline conditions are separate outcomes.
5. The international visitor who does not arrive
Better operations cannot fully compensate for a missing source of demand. International travel introduces another gap between an encouraging headline and the economic activity underneath it.
U.S. Travel's fall forecast, produced with Tourism Economics, projects international visitor spending of $163 billion in 2026, down 6.3% in inflation-adjusted terms. Spending is expressed in constant 2025 dollars. Inbound visits are projected at 67.8 million, down 0.7% from 2025; the much larger spending decline shows why arrival counts alone provide an incomplete picture.[15]
The association projects a nearly $11 billion reduction in international visitor spending across the travel economy, alongside a record 2.44 billion domestic trips. Total real travel spending is nevertheless forecast to decline 0.7%.[16] More trips can coexist with less spending.
For a gateway hotel, the composition of demand matters as much as its size. A replacement booking can bring a different length of stay, booking cost, rate or pattern of spending outside the room. Domestic travel strength therefore offers an incomplete substitute for the economic contribution of inbound visitors.
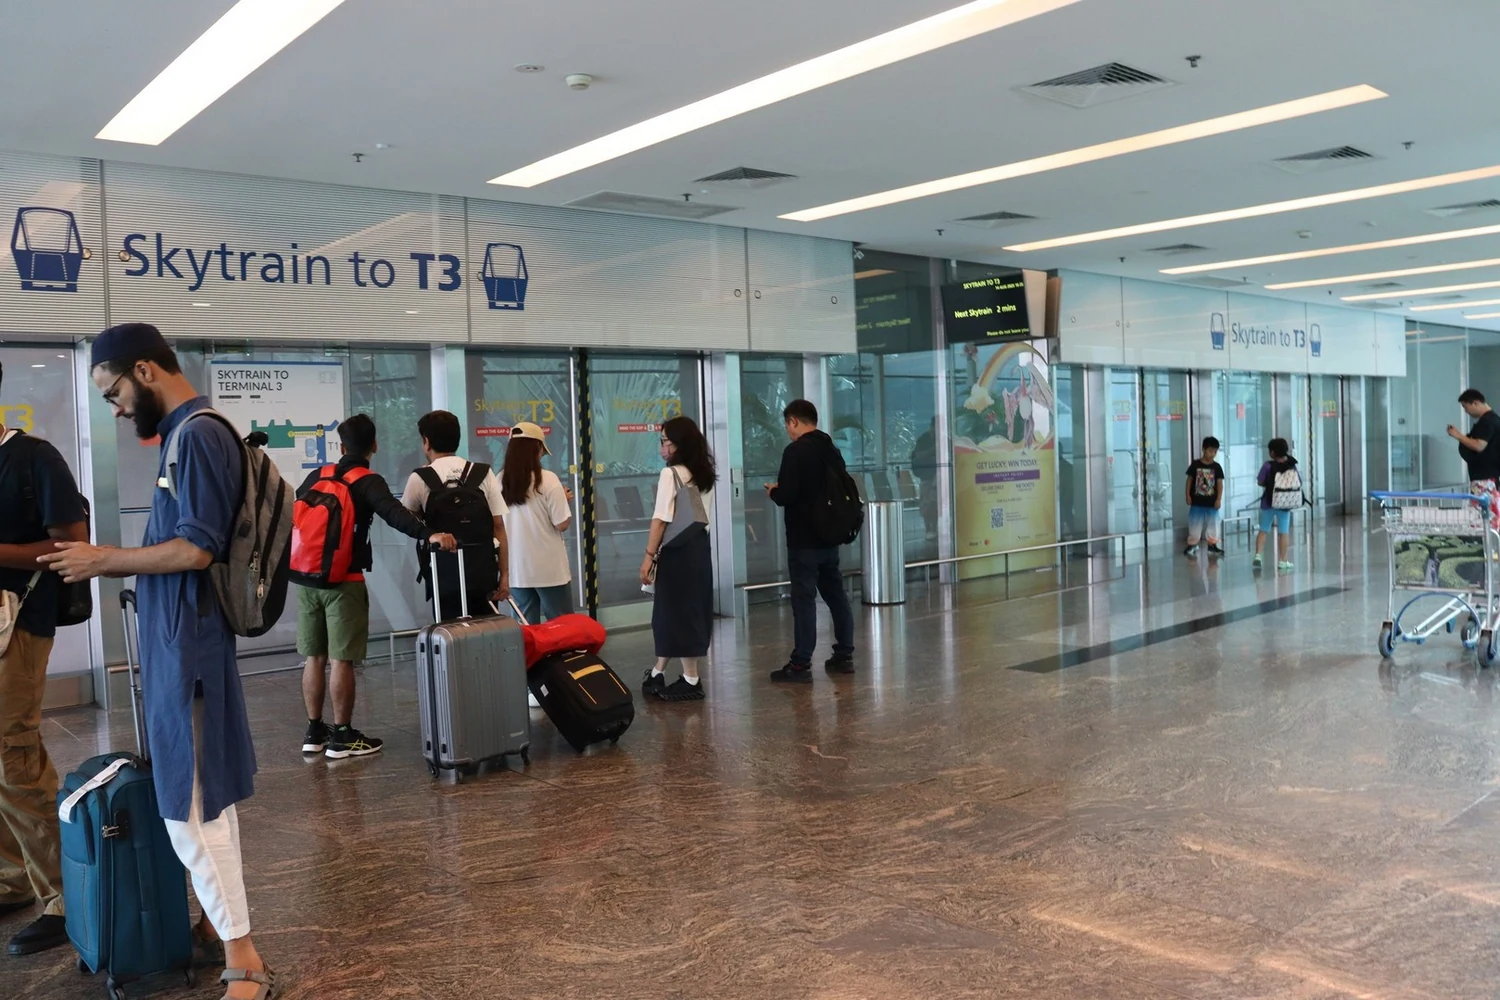
Travelers wait inside Singapore Changi Airport, August 13, 2023. Photo 06 · Mrb Rafi / Wikimedia Commons · CC BY-SA 4.0 · Full credit Source
International arrivals: recovery is uneven
Destination 2019 arrivals 2026 forecast Change United States 79.4 million 67.8 million −14.6% France 90.9 million 111.9 million +23.1% Spain 83.5 million 106.6 million +27.7% Japan 31.9 million 44.9 million +40.7% World 1.47 billion 1.64 billion +11.7%
Source: U.S. Travel [16]. International overnight arrivals. U.S.: fall Tourism Economics forecast; others: April 2026 WTTC estimates. All 2026 values are forecasts; changes follow source precision rather than rounded displayed counts.
U.S. Travel's comparison places America below its 2019 arrival level while France, Spain and Japan stand above theirs. The U.S. projection is from the autumn forecast; the other destinations and world total use April 2026 WTTC estimates.[16]
The forecast also reveals a split among source markets: visits from Mexico are expected to rise 10.3%, while Canadian visits fall 3.3% and overseas visits fall 5.2%.[15] The demand challenge will land differently across destinations and properties.
Price adds to the competitive challenge. The forecast puts U.S. travel-price inflation at 7.2%, compared with 3.4% for overall consumer prices.[15] Travelers weigh those costs alongside exchange rates, visa access, convenience and perceptions of welcome.
U.S. Travel is pressing for expanded visa processing, fewer entry barriers, restored Brand USA funding and investment in aviation systems.[16] Its agenda reaches well beyond hotel marketing to the conditions that make a destination accessible and attractive.
A hotel sells access to a destination as well as a room. When the cost, inconvenience or uncertainty of reaching that destination increases, the property's own service improvements have limited power to reverse the decision. This is where hospitality's dependence on infrastructure becomes impossible to ignore.
6. The systems behind every arrival
A reservation depends on more than a booking engine. It assumes that the traveler can reach the property and that the hotel can handle the information entrusted to it. November exposed vulnerabilities on both sides of that assumption.
On November 13, a telecommunications problem prompted a nationwide FAA ground stop at about 3:30 p.m. Eastern; traffic resumed at 8:15 p.m. In its November 15 account, the agency said instability affected 17 of 22 air-route control centers. Its preliminary investigation identified excessive connection attempts involving sites in Amarillo, Texas, and El Dorado, Arkansas, where contractor L3Harris had been working on a router.[17]
The FAA said blocking the sites stabilized the network; it also disabled the relevant function on more than 60 similar routers while the root-cause investigation continued. Some communications and radar feeds remained reliable, and approximately 3,500 airborne aircraft landed safely. The agency recorded 12,462 cancellations that day, including 9,082 by major airlines, although the ground stop did not account for every cancellation.[17]

United Airlines aircraft parked at Chicago O’Hare during the pandemic-related collapse in air travel, August 27, 2020. Photo 07 · Tigerdude9 / Wikimedia Commons · CC BY-SA 4.0 · Full credit Source
Safety procedures held, but the interruption exposed how dependent the travel economy is on a small number of critical networks.
For hotels, disrupted flights can generate opposite effects at different properties: cancellations at a planned destination and unexpected demand near an airport. STR analysts writing for CoStar on November 20 reported that airport-hotel demand rose 20.3% over the affected Friday and Saturday, with occupancy reaching 84.7% and RevPAR increasing 33.7% from a year earlier. They associated the surge with flight disruption while also noting an easier comparison and broader hotel-demand strength.[22]
Here is the paradox in its sharpest form: a disrupted journey can produce a stronger hotel revenue report. Airport properties may gain stranded travelers while hotels at their intended destinations lose arrivals. RevPAR records the room sold, not the journey that failed.
The management implication is already clear. A hotel's demand forecast contains assumptions about systems outside its control. Contingency arrangements for late arrivals, stranded travelers, group communications and refund decisions can determine how well it absorbs a disruption. A healthy quarter provides no test of those arrangements until they are needed.
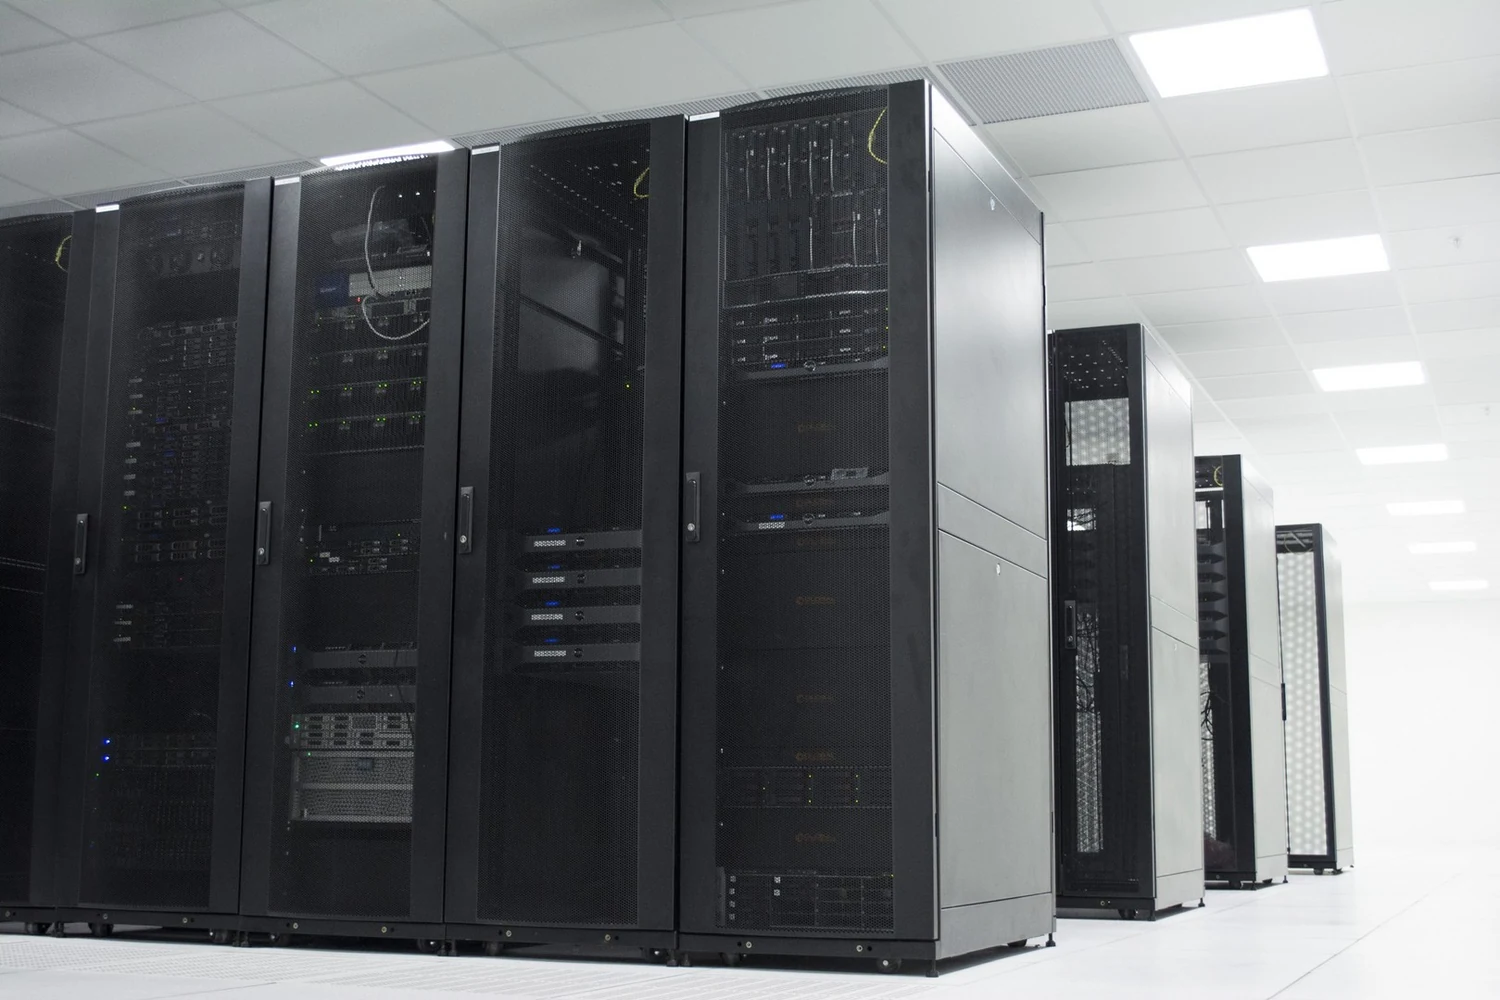
Server racks at GIP Networks, April 19, 2017. Archival infrastructure photograph. Photo 08 · Acirmandello / Wikimedia Commons · CC BY-SA 4.0 · Full credit Source
Digital trust presents a different exposure. Security researcher Robbie Wiggins' own account links his Wyndham finding to an Android-app password that opened a Salesforce-hosted database containing customer names, email addresses, rewards identifiers and login tokens, with millions of entries.[18]
Wyndham told TechCrunch it addressed the issue and found no evidence of unauthorized access; the outlet reported that the credential was revoked.[19]
The reported exposure raises questions about how guest data was protected and how access was controlled. The number of affected customers remains unverified.
MITRE's Common Weakness Enumeration identifies embedded credentials as a recognized software weakness, CWE-798. A secret distributed inside software can be extracted, putting the systems it unlocks at risk.[20]
The governance question extends beyond removing a password. Can an organization identify the period of exposure, examine access records, limit permissions and receive outside vulnerability reports promptly? Those are tests of operational accountability. An absence of detected misuse is relevant evidence, but it is not a substitute for knowing how an exposure was investigated.
The systems that deliver guests and protect their information are part of the service promise, even when they are invisible during an ordinary stay. Their reliability belongs in the same business assessment as occupancy, rate and revenue.
7. What gets built when capital is expensive
Development provides another view of the industry's confidence and constraints. A proposed hotel represents an expectation about future demand. An open hotel represents capital committed, construction completed and an operating business ready to receive guests. The distance between those stages matters.
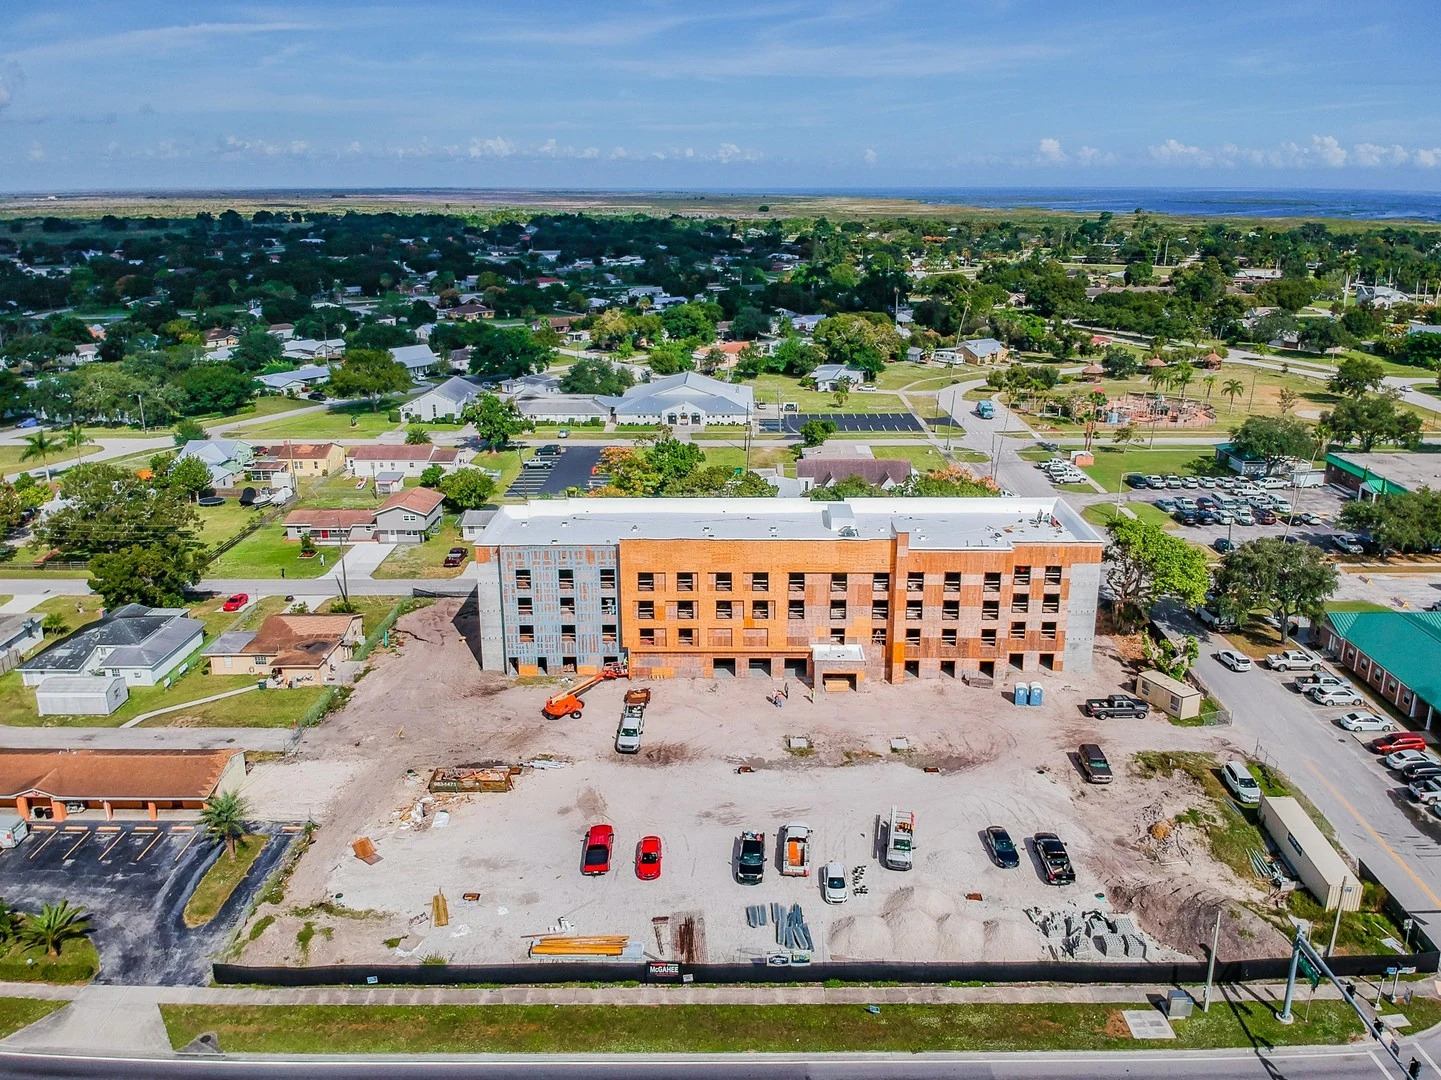
A Hampton Inn under construction in Clewiston, Florida, November 6, 2018. Photo 09 · Ironictechsupport / Wikimedia Commons · CC BY-SA 4.0 · Full credit Source
Lodging Econometrics counted 5,901 projects and 692,999 rooms in the U.S. pipeline at the end of the third quarter. Only 1,094 projects were under construction; 2,175 were scheduled to start within twelve months and 2,632 remained in early planning.[21]
A pipeline is not the same as new supply
Stage at Q3 2026 Projects Rooms Under construction 1,094 137,371 Starts planned within 12 months 2,175 246,793 Early planning 2,632 308,835 Total pipeline 5,901 692,999
Source: Lodging Econometrics, Q3 2026 [21]. Scheduled starts and planning are intentions, not completed hotels.
Most of that pipeline remains on paper. Financing, approvals, costs and owners' decisions will determine how quickly planned projects become operating hotels.
Extended-stay hotels account for 2,352 projects, about 40% of pipeline projects but 34% of rooms. Shared-site developments account for 1,506 projects. Luxury and upper-upscale pipelines reached record project counts, at 108 and 375, respectively.[21]
Those categories overlap: extended stay describes a stay pattern and operating concept; chain scale describes market positioning; a shared site describes a development arrangement. Together they show the different ways developers are configuring the next generation of hotels.
Longer stays offer an appealing operating model. Fewer guest departures can mean fewer room turnovers, and some extended-stay formats offer a narrower service package. The economics still depend on each property's housekeeping schedule, staffing, amenities and local demand for longer visits.
Shared-site projects offer another route to reducing costs through common infrastructure and selected services. Realizing those savings requires coordination across brands and guest expectations.
Upper-midscale and upscale hotels remain central to development, together accounting for approximately 59% of projects and 53% of rooms, calculated from LE's published counts.[21] Those totals put the traditional middle of the market at the heart of the pipeline.
New hotel openings and forecasts
Period Hotels Rooms Supply increase¹ 2026 through Q3 · actual 407 46,031 — 2026 full year · forecast 598 68,191 1.2% 2027 · forecast 668 72,667 1.3% 2028 · forecast 775 86,377 1.5%
Source: Lodging Econometrics [21]. ¹ LE’s reported supply-growth forecast; the release does not specify a closure adjustment.
LE forecasts 598 openings in 2026, 668 in 2027 and 775 in 2028.[21] Those prospective additions sit beside the industry's refinancing obligations: owners must fund both the assets already operating and the hotels they intend to open.
For existing owners, slower supply additions can help protect occupancy and rates. For destinations, constrained development can limit new choices and modernization. Developers must weigh construction and financing costs against the demand a new hotel can capture.
This is the final turn in the revenue paradox. Scarcity can support a property's room rate while also reflecting difficulty financing its next competitor, its own renovation or the replacement of aging stock. A favorable trading environment and an easy investment environment are not the same thing.
8. Beyond RevPAR
RevPAR deserves its place in the hotel's daily conversation. It tells an owner and operator something essential about how effectively available rooms are being sold. The error is asking it to answer questions it was never designed to answer.
A property with rising room revenue may still have too little cash to meet a loan maturity and fund required improvements. Another may show a better labor ratio while losing the experience needed to maintain service. A third may perform well until a transportation failure or data exposure reveals weaknesses that ordinary operating reports left untested.
Success must be demonstrated across the business. A favorable room-revenue figure is the beginning of that assessment, not its conclusion.
Financial resilience begins with the relationship between the property's operating income, financing obligations and capital needs. A sound balance sheet gives an owner choices when conditions change. It also gives the operating team room to maintain the asset without treating every necessary repair as a threat to the month-end result.
Workforce resilience appears in whether people can do the work well and choose to remain. Compensation matters, but so do dependable schedules, realistic workloads, competent supervision and opportunities to develop. Technology earns its place when its benefits can be traced beyond a faster management report to a better working day and a dependable guest experience.
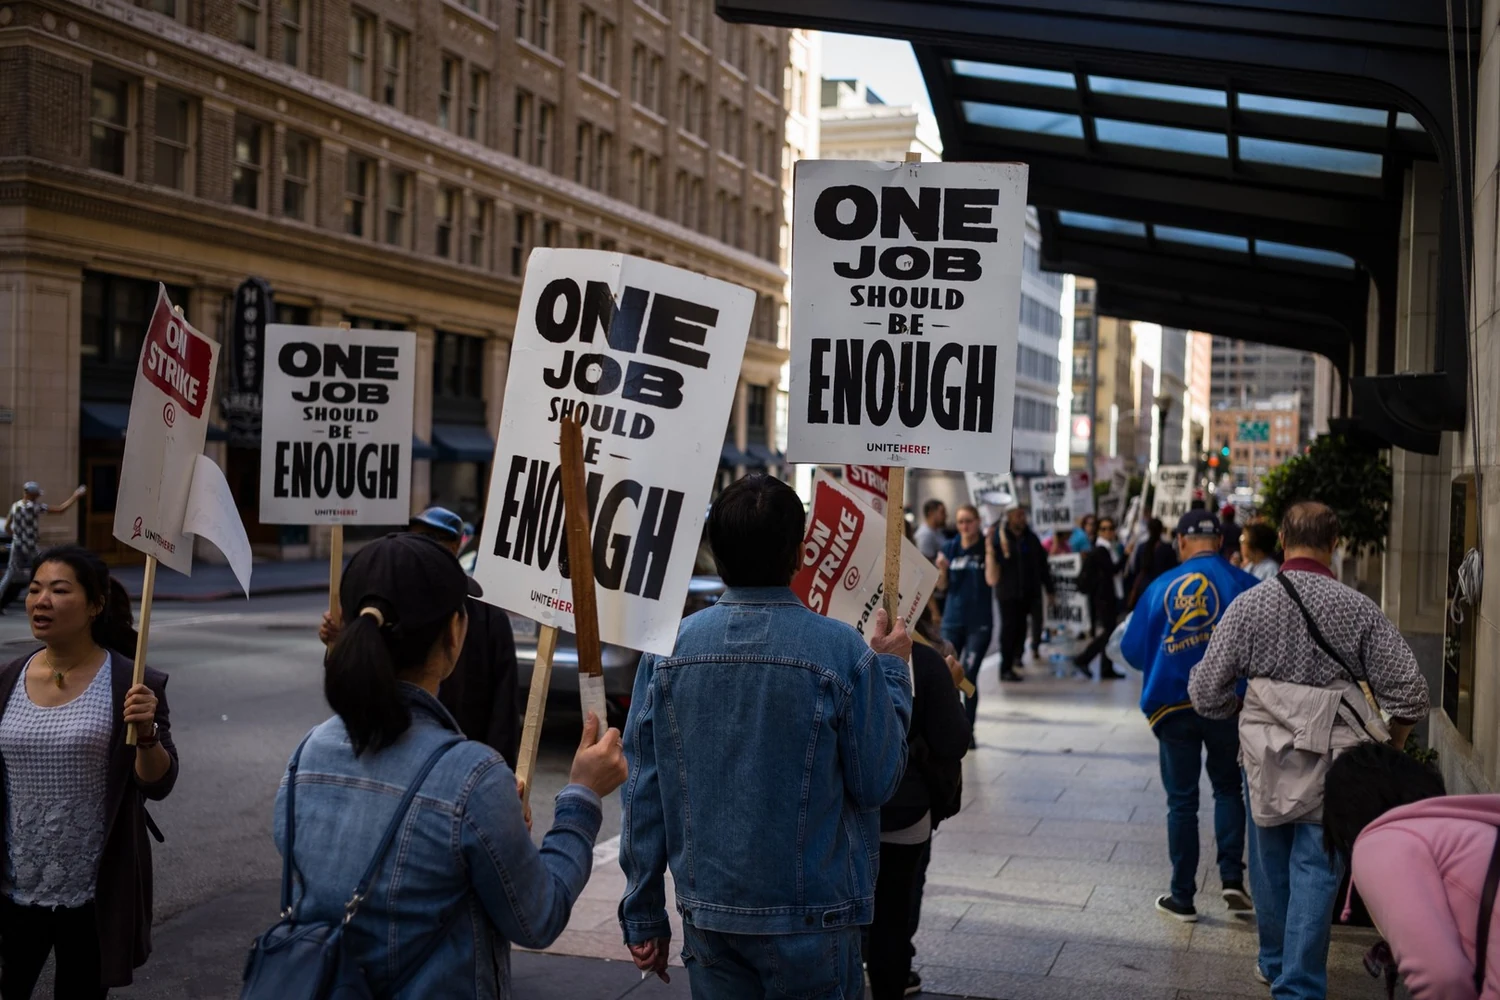
Palace Hotel workers carry “One job should be enough” signs during their San Francisco strike, October 6, 2018. Photo 10 · Bastian Greshake Tzovaras / Flickr via Wikimedia Commons · CC BY-SA 2.0 · Full credit Source
Operational resilience is established in the less visible arrangements: secure access, maintained equipment, usable contingency plans and the ability to investigate a failure honestly. Public transportation infrastructure sits beyond the hotel fence, but its reliability belongs inside the industry's understanding of its own commercial exposure.
Guest value binds these dimensions together. A higher room rate makes a claim about what the stay is worth. If an owner cannot renew the property, if a team cannot deliver the service or if a guest cannot trust the systems behind the reservation, that claim becomes harder to sustain. Revenue collected today cannot by itself certify the durability of tomorrow's demand.
The polished lobby and the strong quarterly result remain achievements. They become convincing evidence of enduring success only when the obligations and working conditions behind them can support the promise being sold.
RevPAR measures what the room earns. Resilience determines whether the hotel can keep its promise.
The companion conversation
The Deep Dive — Episode 01: Hotel Industry Under Pressure. The companion discussion explores the industry's contradictions; this feature supplies the evidence, context and source record. Research and analysis by The Hospitality Gazette, based on sources reviewed November 21, 2026. Opening illustration generated with AI. Published by Saint Leo Press. © 2026 Saint Leo Press.
Sources and reporting notes
All sources reviewed November 21, 2026. Numbered citations link to this register; source titles link to the publications. Primary releases and reports are distinguished from attributed independent reporting.
[1] CBRE · October 26, 2026 Hotel RevPAR Growth Accelerates on Strong Q3 Demand
Primary research summary. Q3 occupancy, ADR and RevPAR; demand versus supply.
[2] CBRE Research · Q3 2026; released October 26, 2026 Figures — U.S. Hotel — Q3 2026
Primary research PDF. Pages 2 and 9: nominal versus real RevPAR; wage and inflation comparisons.
Trade reporting of CoStar data. Week ending November 7; national and market results.
[4] Hotel Management · November 12, 2026 Hotel deals rise as $84 billion maturity wall approaches
Trade reporting of JLL research. Maturity schedule, chain-scale comparisons, loan originations and financing conditions. Original JLL report was not directly obtained.
[5] U.S. Government Publishing Office · 2025 annual CFR edition 12 CFR § 1234.14 — Definitions
Primary reference. NOI and debt-service coverage terminology.
Trade reporting with JLL executive interviews. Year-to-date transaction totals, buyer composition, million-dollar-per-key trades and countervailing refinancing commentary.
Trade reporting of JLL research. Market divergence and corroboration of maturity and investment figures.
Primary union statement. Bargaining-unit size, contract term, announced gains and union's 62-day count.
Independent reporting of union, company and regulator information. Ratification and return dates, 63-day count, gaming revenue and Wynn response. Gaming data verified through this report, not the regulator's raw file.
[10] UNITE HERE · October 13, 2026 Chicago Hotel Workers Strike
Primary union statement. October 9 launch and bargaining population of more than 7,000 workers across 46 hotels.
Independent trade reporting. November 14 walkouts, eleven-property count, demands and Marriott response.
Primary association release with vendor-supplied evidence. Leaders’ AI perceptions and first-half HPOR results.
Primary survey presentation. 107 leaders, August–September fieldwork, question-specific denominators and payback findings. Public page does not display the 84%/15% item.
Primary association/vendor report. Pages 4–7: perception figures, Cote case study, HPOR and turnover; observational findings and company accounts.
Primary forecast; live page may update. 2025 constant dollars, inbound spending and visits, source-market variation and travel- price forecast.
Primary association release and advocacy. Travel totals, country comparison and methodology, policy positions. Other-country forecasts use April 2026 WTTC data.
Primary agency account; investigation preliminary. Timing, affected centers, initial technical findings, safe landings and cancellation attribution caveat.
Primary researcher summary. Hardcoded app password, database access and data categories; no independent Gazette test or customer count.
Original reporting with company response. Company response and credential revocation; no finding of malicious exfiltration.
Primary technical reference on hard-coded credentials and their consequences.
Primary construction research release. Pipeline counts, project stages, segment shares, openings and forecasts. The Gazette calculates the combined upper-midscale/upscale shares as 59% of projects and 53% of rooms; the release’s stated 66% and 63% do not reconcile with its published counts.
Primary industry data analysis. Airport-hotel demand, occupancy and RevPAR during November 13–14; comparison effects and broader underlying demand.
Photography credits
All ten photographs are archival. Captions preserve their original locations, dates and illustrative context. Display copies are proportionally resized and JPEG-compressed, with EXIF orientation normalized; no cropping or tonal changes were applied. Source photographs retain their respective public-domain status or Creative Commons licenses.
Photo 01 — Brown Palace atrium Library of Congress, Prints & Photographs Division, photograph by Carol M. Highsmith, LC-DIG-highsm-48689. Gates Frontiers Fund Colorado Collection within the Carol M. Highsmith Archive, Library of Congress, Prints and Photographs Division. Source · Public domain Source photograph · License / rights information
Display copy proportionally resized and JPEG-compressed; EXIF orientation normalized. No crop or tonal change.
Photo 02 — Encore Boston Harbor Encore Boston Harbor September 2024 from Riverwalk.jpg — 4300streetcar, Wikimedia Commons. · CC BY 4.0 Source photograph · License / rights information

Display copy proportionally resized and JPEG-compressed; EXIF orientation normalized. No crop or tonal change.
Photo 03 — A picket line at the hotel entrance Strike at the Grand Hyatt San Francisco 3.jpg — Mx. Granger, Wikimedia Commons. · CC0 1.0 Source photograph · License / rights information

Display copy proportionally resized and JPEG-compressed; EXIF orientation normalized. No crop or tonal change.
Photo 04 — The work behind the welcome Housekeeper, Istanbul, Turkey (9603542939).jpg — l0da_ralta, Flickr via Wikimedia Commons. · CC BY 2.0 Source photograph · License / rights information

Display copy proportionally resized and JPEG-compressed; EXIF orientation normalized. No crop or tonal change.
Photo 05 — Automation in the lobby Robot Yotel Hotel Downtown Miami FL, Dec 2022.jpg — Phillip Pessar, Flickr via Wikimedia Commons. · CC BY 2.0 Source photograph · License / rights information

Display copy proportionally resized and JPEG-compressed; EXIF orientation normalized. No crop or tonal change.
Photo 06 — Travel through an international hub Passengers waiting at changi airport terminal.jpg — Mrb Rafi, Wikimedia Commons. · CC BY-SA 4.0 Source photograph · License / rights information

Display copy proportionally resized and JPEG-compressed; EXIF orientation normalized. No crop or tonal change.
Photo 07 — Aircraft on the ground United Planes at ORD.JPG — Tigerdude9, Wikimedia Commons. · CC BY-SA 4.0 Source photograph · License / rights information

Display copy proportionally resized and JPEG-compressed; EXIF orientation normalized. No crop or tonal change.
Photo 08 — The infrastructure behind digital service GIP Servers.jpg — Acirmandello, Wikimedia Commons. · CC BY-SA 4.0 Source photograph · License / rights information

Display copy proportionally resized and JPEG-compressed; EXIF orientation normalized. No crop or tonal change.
Photo 09 — A hotel takes shape Hampton Inn, Clewiston, Florida under construction.jpg — Ironictechsupport, Wikimedia Commons. · CC BY-SA 4.0 Source photograph · License / rights information

Display copy proportionally resized and JPEG-compressed; EXIF orientation normalized. No crop or tonal change.
Photo 10 — One job should be enough One job should be enough.jpg — Bastian Greshake Tzovaras, Flickr via Wikimedia Commons. · CC BY-SA 2.0 Source photograph · License / rights information

Display copy proportionally resized and JPEG-compressed; EXIF orientation normalized. No crop or tonal change.
Copyright in licensed photographs remains with the respective rights holders; Saint Leo Press claims no ownership of third-party photographs. Reuse must follow each photograph’s license. No endorsement by a photographer, depicted person or business is implied.